What does New Relic do?
Keeping an eye on your servers and apps
The TL;DR
New Relic is observability software: teams use it to monitor the performance of their applications and infrastructure.
Part of developing a successful application is making sure it stays up and running after you build it
The two main areas teams need visibility into are the application layer (APM) and the infrastructure layer (your servers and such)
New Relic provides a series of APIs for collecting data from those layers, visualizing it, and digging deeper into why things went wrong
New Relic was one of the first commercially available SaaS products for monitoring (targeted at developers), originally founded in 2008. They went public in 2014 and today are worth around $7B.
A brief, brief history of deployment
Every app that you use on the internet is running on a server somewhere. Until recently, that used to literally mean one server - a giant computer - so you had whatever computing power you had, and you had one place to look if you wanted to know why things were broken – or worse, why things were slow. There were basic utilities in Linux – the standard server operating system – for monitoring a lot of this stuff, like the htop command – which is still used a lot, mind you – but this was mostly a reactive process. Something would go wrong, and you’d check why.
Then a few things changed:
Infrastructure got easier, but more complicated
The one-app-one-server paradigm is not very true anymore. Most major apps now run as distributed systems, or a set of multiple, interconnected servers. It is obviously harder to debug many servers than it is to debug one server; but that’s only part of the problem.
With everything running on Docker, the concept of “servers” got a lot more complicated, because there was a thick layer of abstraction between your code and what infrastructure it was running on. Docker creates a standalone container on your servers; now, something can be wrong with your server or that container, or even the relationship between the two.
And in addition to that increased surface area, it also meant nicher things to worry about, like your Kubernetes cluster having a hard time restarting pods. New approaches to infrastructure – as well as new layers for managing that infrastructure – means monitoring is much more complex than it used to be.
The internet got bigger
As the internet became widely available, apps are now used by like, billions of people. So when 2 billion people are loading Facebook.com every hour as opposed to 200, a lot more things can go wrong, both in terms of surface area (bigger products) and in terms of having just so many people hitting your servers. Supporting an app that’s trying to handle hundreds of millions of requests per second is very different from one that’s handling thousands. And in addition to that, it’s more and more important to fix things quickly, since there are always a lot of people trying to use what’s broken.
Everything moved to the cloud
The last important change to keep in mind: most apps you access today are sending data across the web, instead of running on your company’s local data center. The cloud is great! Companies can get set up way faster, for much cheaper (initially), and get access to the fastest and best infrastructure around. But it also means that every single request you make from your browser – be it to fetch your emails or send a tweet – has to travel over the public web, instead of across little internal wires. That makes performance much more unpredictable; and doubly important to measure.
So in summary, developers were faced with more complex infrastructure and more pressure to understand, monitor, and keep that infrastructure running smoothly. This is part of why DevOps (development operations) started to become its own discipline – companies were employing teams of developers just to deploy and monitor infrastructure.
What teams are actually monitoring
To understand New Relic, you need to understand what monitoring is. Building your app is far from the finish line: once you get it out to your users, there’s an entire series of workflows around making sure it continues working, and that it’s fast.
There are two big pieces to modern application / infrastructure monitoring: your application and your infrastructure (i.e. both sides of the slash).
Infrastructure monitoring
Infrastructure monitoring is keeping an eye on any metrics that relate to non-application data. The easiest place to start is the actual server hardware that your app is running on, but it extends beyond that to things like Docker or your network performance.
Starting with your server, there are a few metrics you want to keep an eye on to make sure everything is running smoothly:
CPU – how much processing your server is doing as a function of its total processing power (e.g. 3 out of 4 CPUs)
RAM - how much memory your server is using (e.g. 3GB/4GB memory)
Disk - how much storage your server is using (e.g. 450GB/500GB stored)
IO - how fast your server is reading and writing things from memory and disk
Keep in mind that most popular modern applications run on distributed systems, so there’s likely way more than just one server involved. That means you need to keep an eye on metrics like these for all of those servers, and frameworks have evolved to do that for you automatically.
🚨 Confusion Alert 🚨
Observability isn’t just about identifying when things go wrong; it’s also about figuring out why they went wrong, and, of course, how to fix them. The answer usually lies in logs, which are little bits of text your app and infrastructure spit out when they do anything: like “hey we’re starting up” or “hey this specific thing went wrong.” And this is why monitoring tools are usually tightly coupled with log storage and management tools.
🚨 Confusion Alert 🚨
Beyond servers, teams will monitor other parts of their infrastructure. How much data is your database storing, and how much space is left? How long does it take for your Docker containers to build? How long does it take for different servers to speak to each other? These are all questions that developers want to be able to answer quickly and consistently.
Application monitoring
Even with the most performant, 100% perfect infrastructure, you’re not guaranteed to have a high performing app: things can go wrong for any number of reasons. Recall that a modern app consists of a frontend – the visual, interactive part made up of HTML, CSS, and JavaScript – and a backend, which deals with the data and logic backing that frontend. Things can go wrong with both of those things, and even in the interaction between them. Some common use cases:
Request performance: how quickly are your API endpoints responding?
Error monitoring: are you getting HTTP errors on your requests? Is your code erroring out? If so, what kinds of errors? When are they happening?
Frontend load times: how quickly is your app loading? Are interactions from your users quick?
In some cases, issues with these metrics can relate to underlying issues with your app’s infrastructure. But many times they’re localized issues that need fixing, like your code not being able to handle weird edge cases.
The core New Relic product
With that extensive background in mind, you’re set up to understand what New Relic does. In short, they offer a comprehensive set of tools for all of the monitoring that developers need, from application to infrastructure and beyond. Datadog is a useful comparison.
Here’s how it works:
Install New Relic’s agents on whatever you want to monitor
To gather the data you want to look at, you need to install some New Relic code – referred to as an agent – on any property you want to monitor. For infrastructure level items, this is pretty straightforward: New Relic provides easy to install agents for Kubernetes, Linux, AWS services, and even mobile platforms like iOS. Some configuration is required, but it’s mostly out of the box.
For application level stuff, you need to write some code. New Relic provides an SDK (a set of APIs) for picking which pieces of your application you want to monitor and how. For basic stuff like HTTP requests, these agents work out of the box, but you can also add custom instrumentation for however you want to monitor your app.
Build dashboards and visualizations
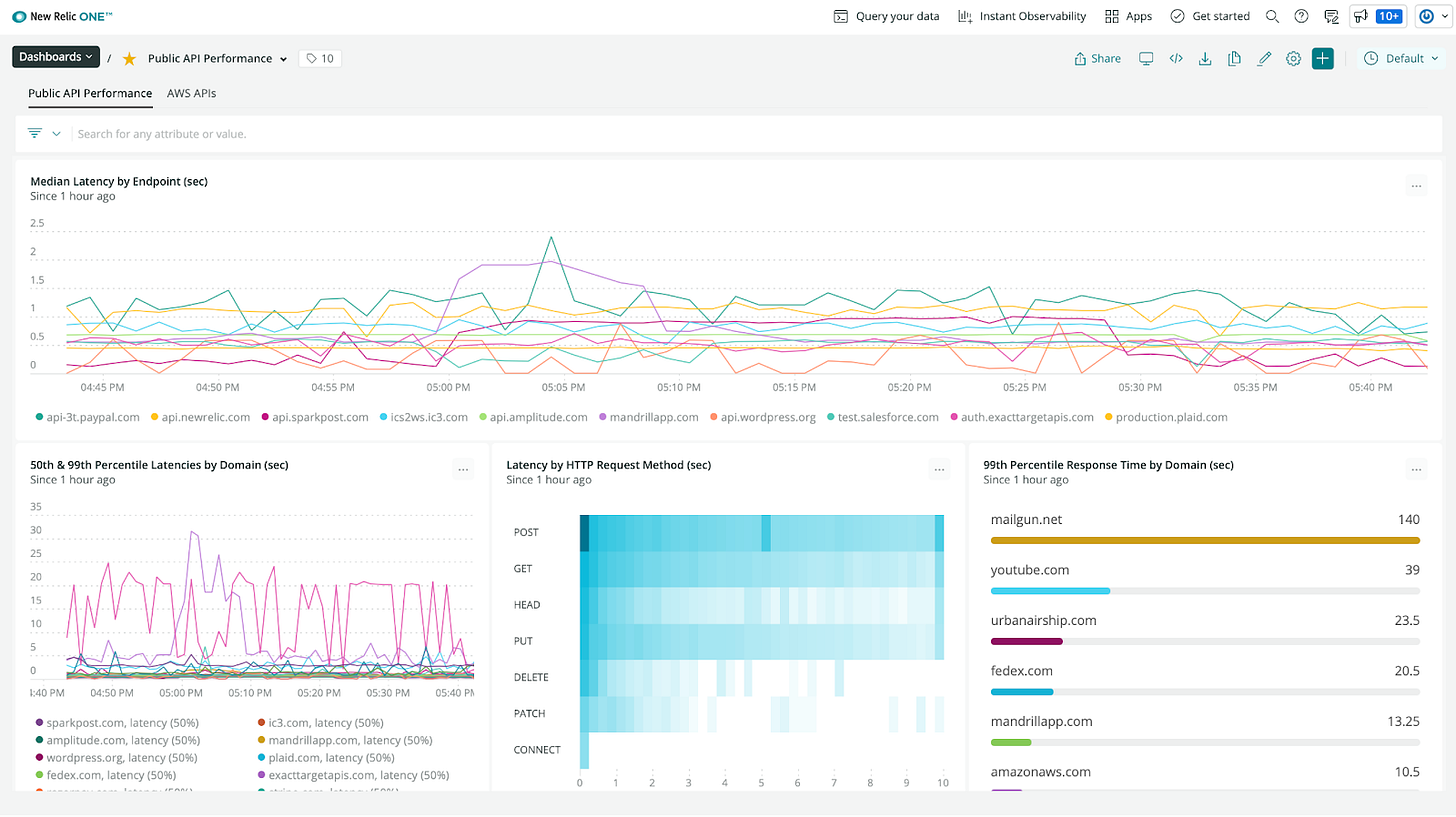
Once your agents are installed and data is flowing, you can basically do whatever you want with it. Teams will usually build dashboards that pull together different data sources:
These dashboards are usually a combination of numerical data – how many errors have we seen on the frontend? How long are requests taking? – as well as aggregated data about logs and performance over time. Note that New Relic is actually storing the data they’re collecting on their servers, which is part of their value proposition; you’d need to store it yourself otherwise.
Dig deeper with traces and logs
Monitoring isn’t just about knowing when things aren’t working; it’s also about making it easier to fix those things. So what exactly do you do when you see that your app is running into issues? Well, Sherlock, you’ll investigate, and the most common place to look is logs, bits of text that your application / infrastructure spit out whenever they do anything. If you’re seeing elevated error rates, you’ll check what those errors actually are, where they’re coming from, etc.
Note that you don’t need to use New Relic for storing logs just because you’re using them for APM and infrastructure monitoring (you could use Elastic, Splunk, etc.), but choosing the same platform for both of these does have its benefits.
Other New Relic goodies
Beyond the standard monitoring workflow (above), New Relic has expanded the product suite to include a lot more DevOps related stuff. A few examples:
Browser monitoring
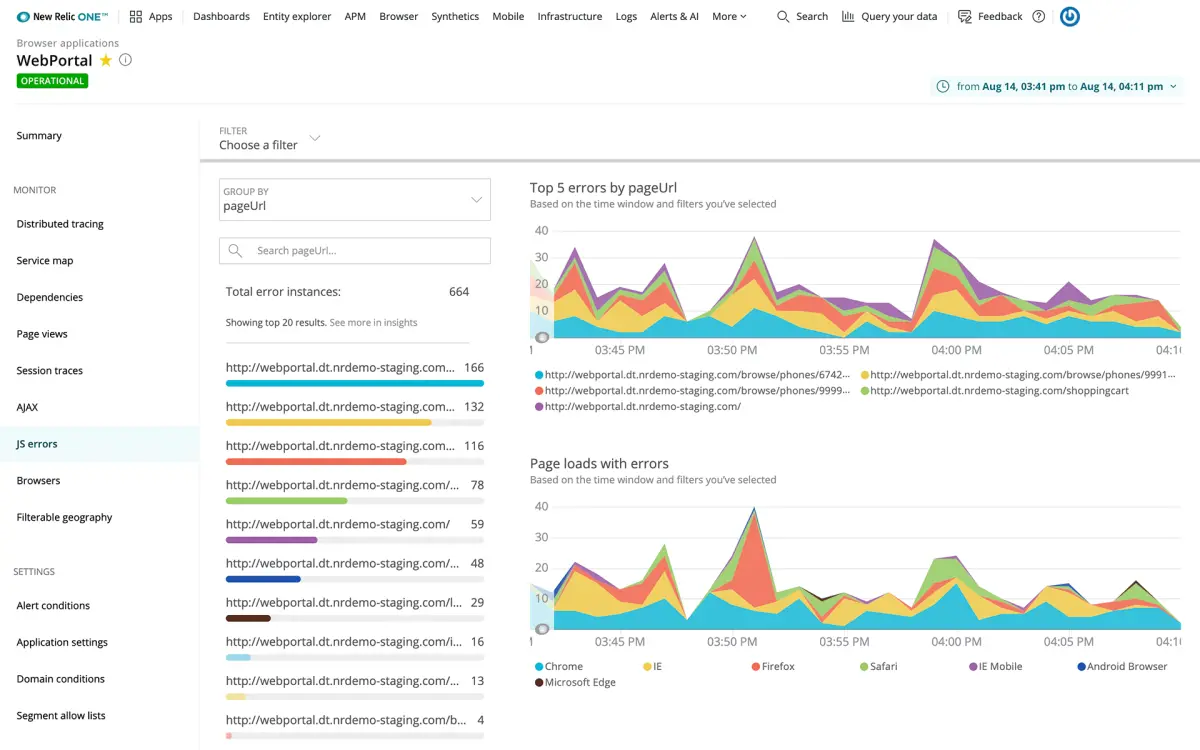
As any developer will tell you, creating web apps for the hundreds of different browser versions out there is a huge pain in the ass. What you developed locally using Chrome might render slightly differently on a version of Safari from 2 years ago, which a big customer happens to be using (there are entire companies like BrowserStack that exist to help with this). New Relic’s browser monitoring product helps track common metrics like page load time, time spent on page, visual stability, and errors.
AI for monitoring
We live in an era of AI for everything, and monitoring is no exception. New Relic’s applied intelligence product will automatically analyze your performance data to find common errors and root causes. I think of this as a nice to have side feature, and it comes free with New Relic’s normal pricing.
Workflows in your IDE
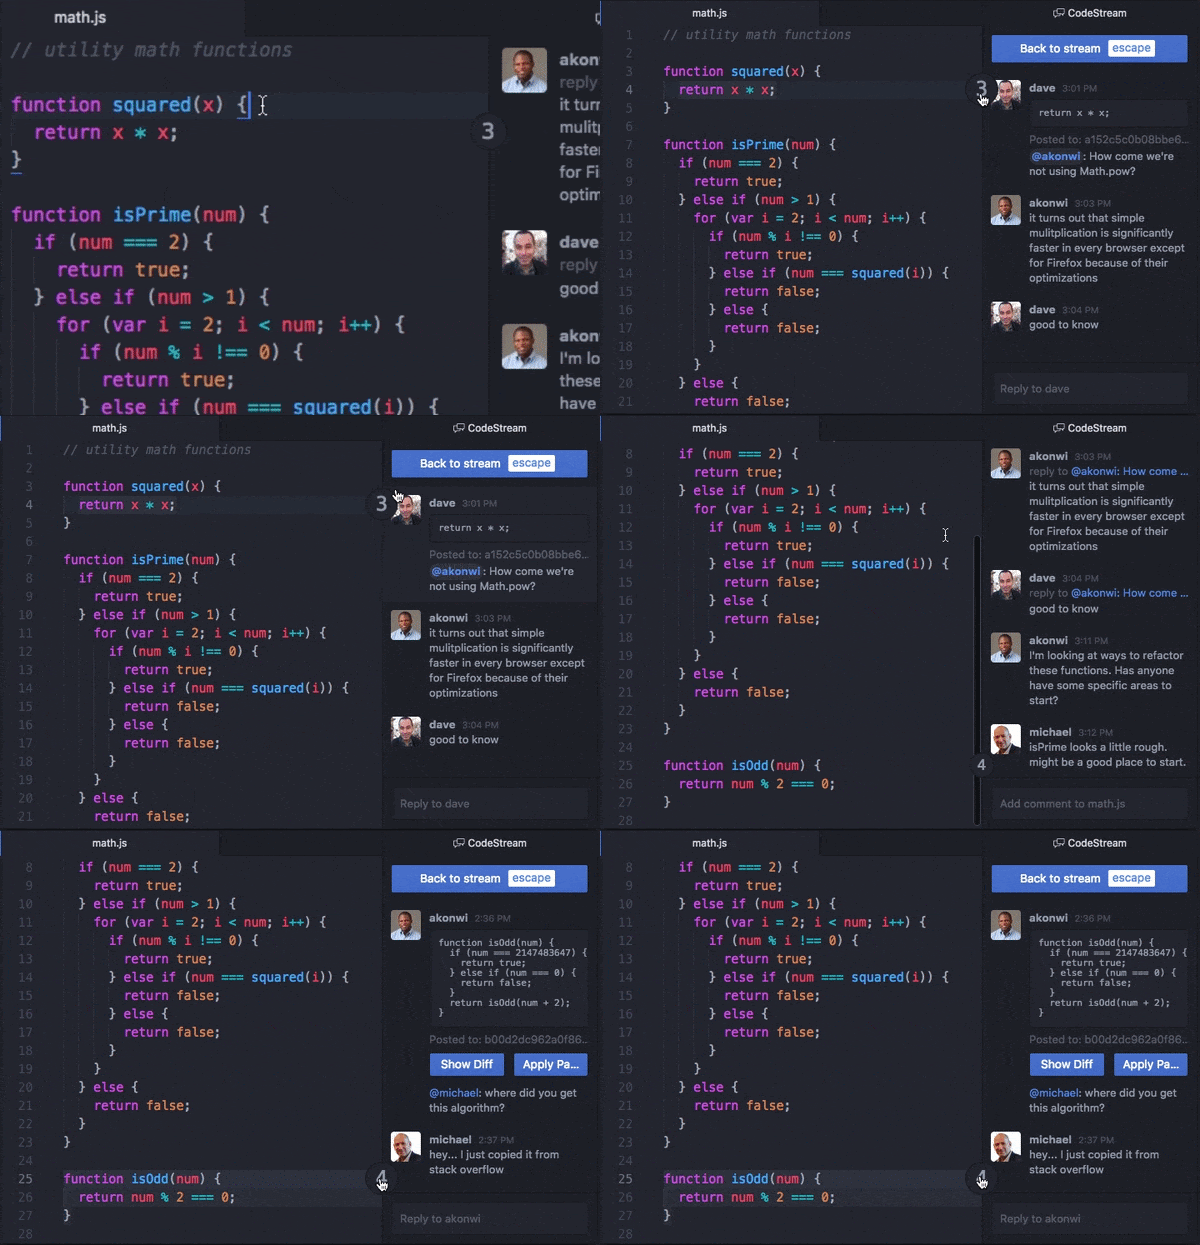
New Relic bought CodeStream in October of 2021 and integrated it into the product suite pretty quickly. The gist is basically moving a lot of the stuff you’d be doing in GitHub or the New Relic UI into your development environment of choice, which for more people is VSCode. There’s a lot you can do with it. One popular use case is bringing comments on your pull requests into your IDE directly:
Source: TechCrunch
There are some basic VSCode extensions that let you do this already, but CodeStream was pretty popular for more advanced stuff. A nice thing you can do with this integration is find an error with your app in the NewRelic UI, click on it, and go directly to the offending code in your IDE instead of having to search for it manually.
The idea with all of this stuff is to be the one stop shop for observability. And the market is getting tougher with large, established options like Dynatrace, Splunk, Grafana, SumoLogic, Elastic, etc. We’ll see where things go!


Great read - small suggestion I would make is take off the Bottom "Confusion Alert" and all alerts. Ironically I have to pause a second to guess if the next paragraph is a part of the alert or not. When scrolling back up it seems obvious that it is a block, but when reading top to bottom it throws me off slightly. Could just be me.
This is a lovely read.