The TL;DR
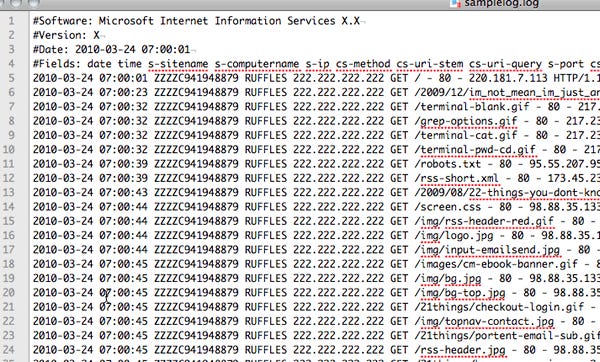
Splunk is a tool for analyzing log data. It helps take this:
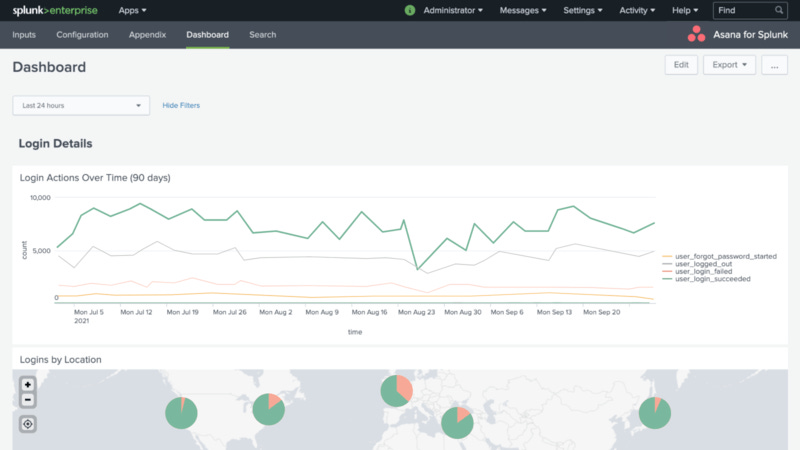
And turn it into this:
$SPLK went public in 2012, and did $2.7B in revenue in 2022, so they’re not a small company by any stretch; accordingly, the product suite has expanded and today is pretty broad. The theme that ties everything together is analysis and visualization of machine data, or in other words, turning that nasty looking set of text into something a human can understand and use to make decisions.
At the core of what Splunk does is the concept of the log – a bunch of unstructured data about events that happened in your system or application, like a server failing, a request to an API being made, someone’s access being revoked; literally anything. So let’s dive into what exactly a log is, how they get generated, and why they’re important.
A brief exploration of the log
“In an ideal world I would have all ten fingers on my left hand so my right hand could just be a fist for punching.”
– Dwight Schrute
In a really ideal world, all of the data we want to analyze would magically sit in perfectly manicured tables with nice column names and no missing data. Unfortunately, reality isn’t so rosy; data is only as good and clean as what generates it, and our systems can get pretty dirty. Data is really (usually) just a record of what happened, and the most popular way of generating and storing that today is a log. A log is just a line that says what happened, where, and when, and includes any necessary other information.
There are logs for everything – server logs, access and authorization logs, event logs, availability logs, resource logs…the list goes on. Let’s walk through a few examples.
Keep reading with a 7-day free trial
Subscribe to Technically to keep reading this post and get 7 days of free access to the full post archives.


